
The Google toolset for site performance analysis
Introduction
Site performance is a big deal. To emphasize an obvious point, if your site pages don’t load quickly, your users are going to drop off at an alarming rate. In this article, we assess a variety of tools provided by Google like the network tab and performance tab in Chrome Dev Tools, PageSpeed Insights, and more to understand your site performance and potential bottlenecks.
Chrome Dev Tools: Network Tab
The Network Tab in Chrome Dev Tools is a great place to start looking at your page performance.
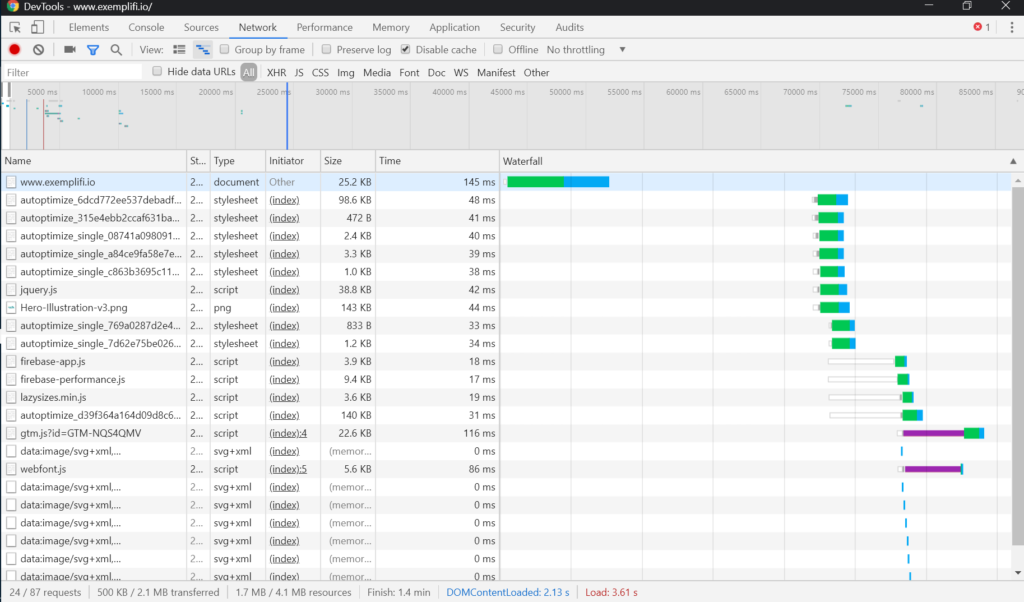
First, it gives you a good sense for how heavy the page is: HTML, Fonts, CSS and JS. Typically images are a major culprit in this area and there are many approaches to reducing their footprint. Second, it gives you a high level sense for how long each asset is taking to load and the sequence of the loading. It is easy to drill down into each asset load for further details:
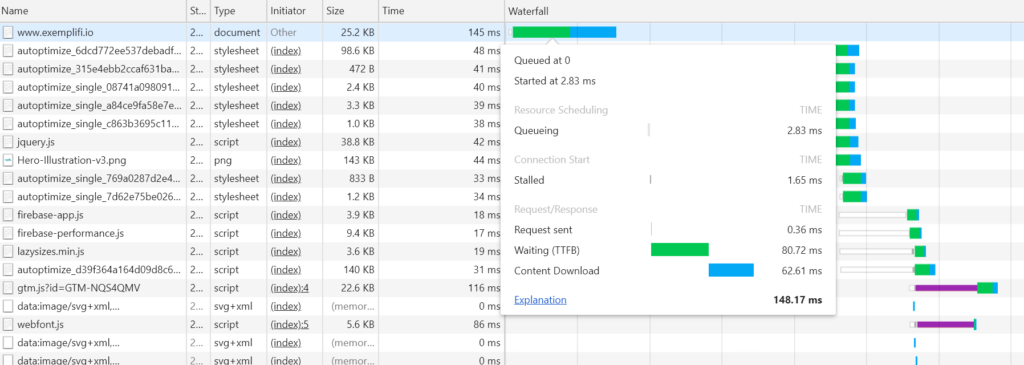
For example, we can see that the overall request took 148ms to load and that 80ms out of that (more than 50%) was spent waiting for a response from the server (also called TTFB – Time to First Bite).
Pagespeed Insights
This is hands-down the most useful tool in the Google arsenal: easy to use and tons of insights of ways to optimize. It analyzes your site performance for both mobile and desktop, gives it a score (algorithm) and provides a lot of recommendations for improvements.
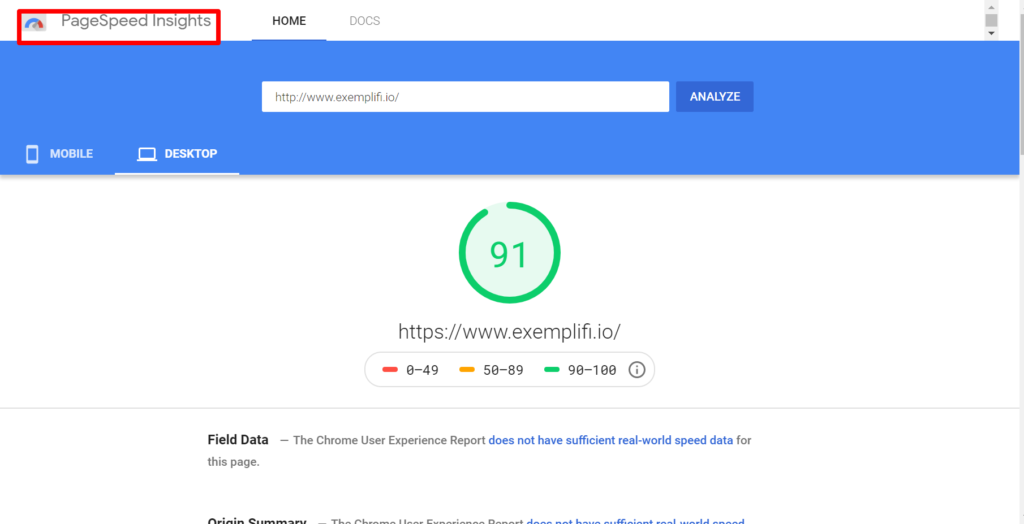
This is also available as an API, accessible via command line and offered within Chrome DevTools. Use it well!
Chrome Dev Tools: Performance Tab
Next up is the Performance Tab of Chrome Dev Tools. This is a heavy hitting analysis of all the browser events — useful for advanced analysis and optimization. We find this to be much more useful for single page applications (SPAs) rather than straightforward sites.
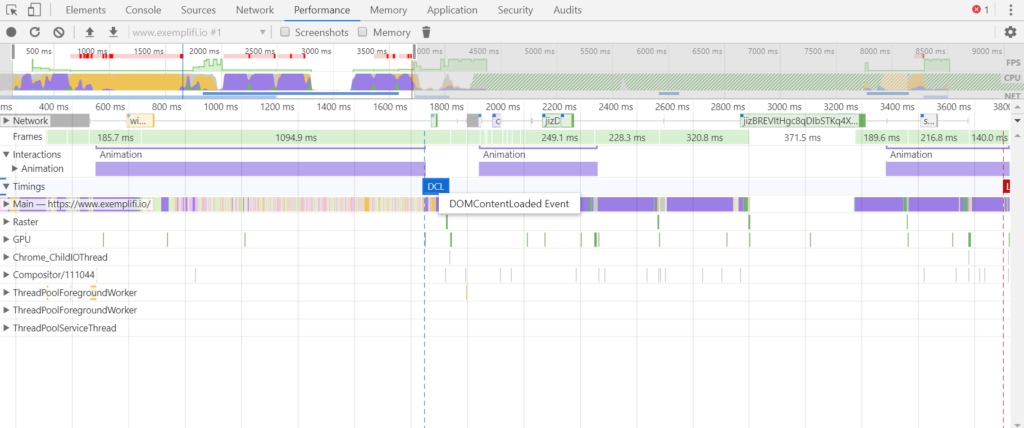
The browser tracks important events such as: First Paint (FP), First Contentful Paint (FCP), First Meaningful Paint (FMP), Time to Interactive (TTI) and others. Picking the right metrics is the topic for a different post. It suffices to say that this is the place where you find all this useful information that you can use to benchmark and analyze your site performance.
Chrome Dev Tools: Coverage Tab
You can use this tool to see the percentage of the document (HTML/Font/CSS/JS) loaded vs. what is actually used.
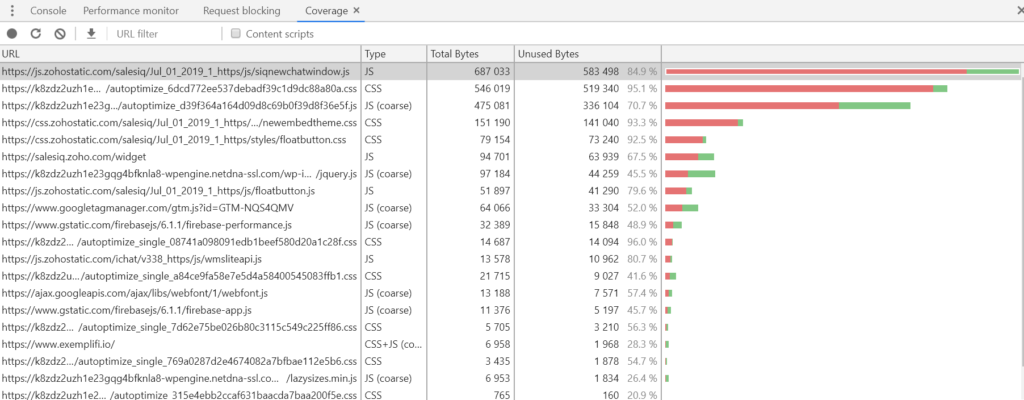
For example, we can see that the first javascript asset is a major culprit. 95% of the code is actually not used when rendering the page.
Firebase Web Monitoring
With Firebase, we move away from the browser tools and towards server-side monitoring. Firebase is typically setup and configured in the Google Cloud. It provides a wealth of insight into your site performance.
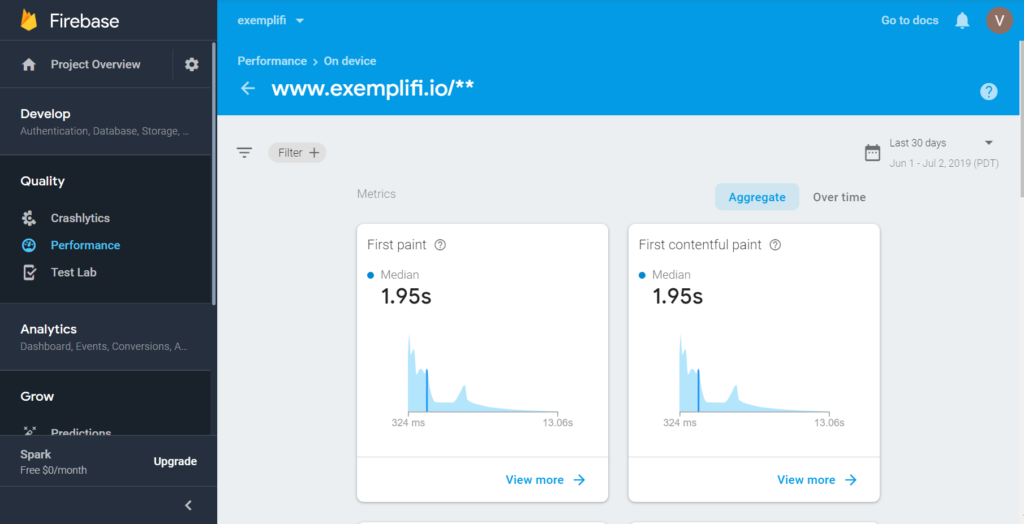
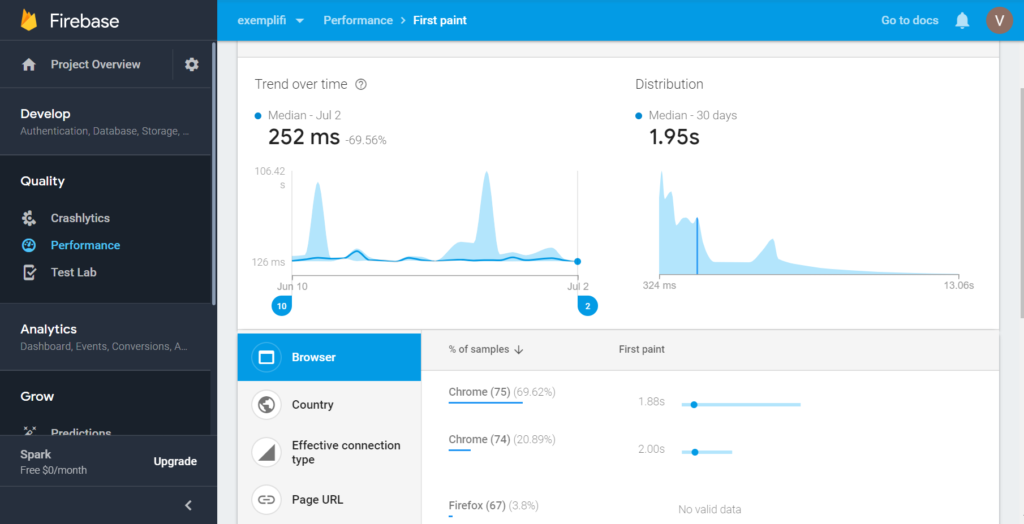
You can now move away from anecdotal testing and focus on the average, median and other statistical measures. You can also monitor performance changes over time.
Performance Budget Calculator
You can estimate your site performance with the cute utility offered by Google. For a given range of HTML, JS, CSS and Font sizes, it computes the expected range for Time to Interactive. This can give you a sense for what to expect with your page.