
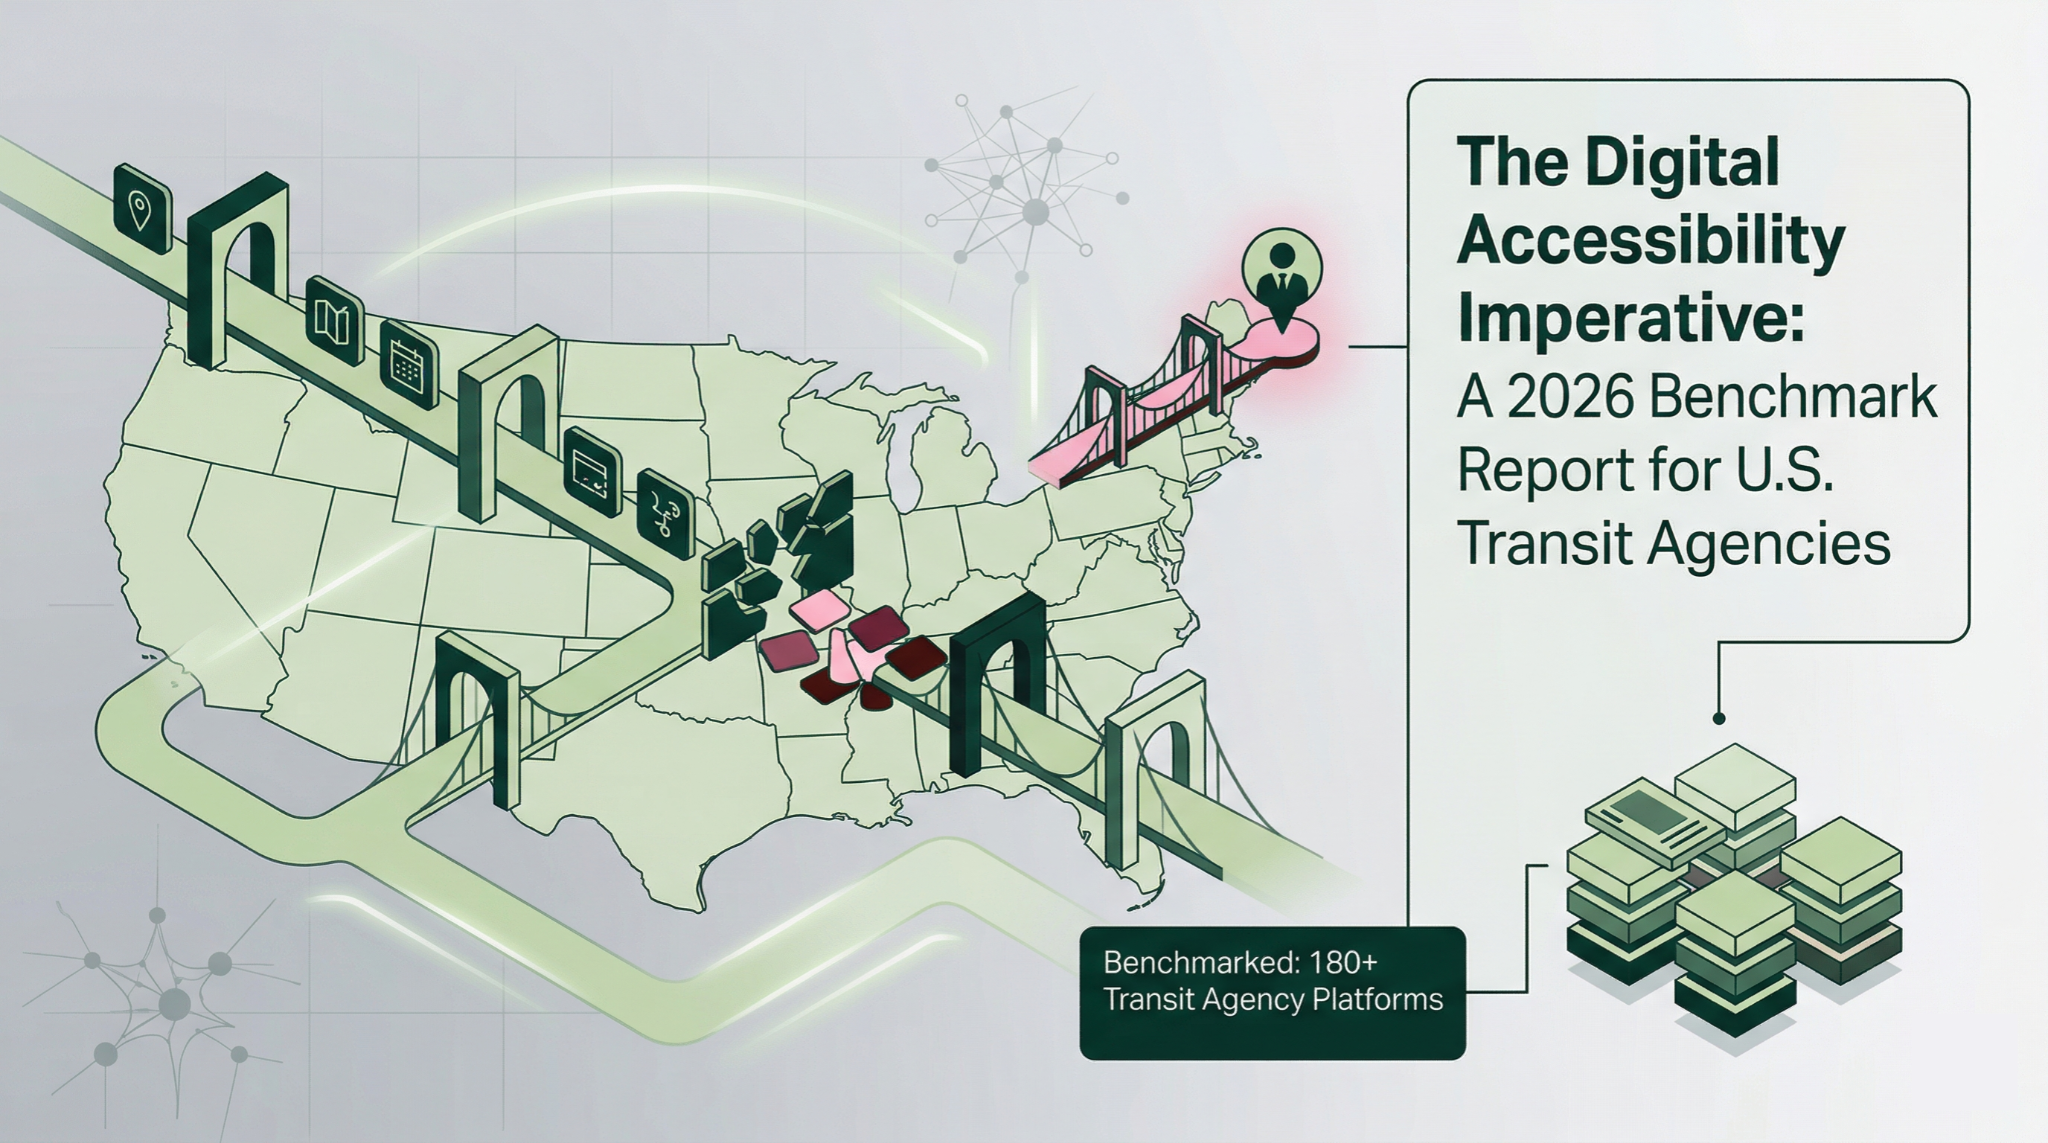
The Digital Accessibility Imperative: A 2026 Benchmark Report for U.S. Transit Agencies
Executive Summary
Public transportation is the lifeblood of American communities, connecting hundreds of millions of passengers to jobs, healthcare, and education every year. As transit agencies have modernized, their websites have become the primary digital front door for riders seeking route maps, schedules, fare information, and real-time service updates. Yet an industry-wide review of more than 180 transit agency digital platforms reveals a critical gap: the vast majority of transit websites across the United States currently face high accessibility compliance risks — and a federal deadline to remedy that is no longer on the horizon. It is here. This report examines the state of digital accessibility across U.S. transit agencies, analyzing trends across varying ridership sizes, regions, and technical architectures. For municipal leaders and transit authorities, these findings represent both a significant legal and operational risk — and an equally significant opportunity to lead.
The Regulatory Moment: DOJ Title II and the WCAG 2.1 Mandate
Digital accessibility in public transit is not merely a technical best practice. It is a fundamental civil right — and increasingly, a federal legal obligation.
Under recent updates to Title II of the Americans with Disabilities Act (ADA), the U.S. Department of Justice (DOJ) has mandated that state and local government services — including public transit agencies — must ensure their websites and mobile applications conform to WCAG 2.1 Level AA standards. Compliance deadlines are phased by agency size, with critical milestones arriving in April 2026 and 2027.
For agencies that have not yet begun remediation, this is an urgent call to action. Failure to comply exposes agencies to significant legal and financial liabilities, including civil rights complaints, DOJ investigations, and costly litigation. More importantly, non-compliance means that riders with disabilities are effectively stranded before their journey even begins.
What is WCAG 2.1 Level AA? The Web Content Accessibility Guidelines (WCAG) are an internationally recognized framework developed by the W3C that defines how digital content should be structured to be accessible to people with a wide range of disabilities — including visual, auditory, motor, and cognitive impairments. Level AA is the benchmark most commonly required by law for public-sector entities, and it encompasses standards such as:
Sufficient color contrast ratios for text and UI elements
Full keyboard navigability for all interactive features
Screen reader compatibility through proper semantic markup and ARIA labeling
Accessible forms, tables, and time-based media
Consistent, predictable navigation patterns
The Industry Landscape: Where Transit Agencies Stand Today
Benchmark data collected across more than 180 U.S. transit agency platforms in early 2026 paints a sobering picture. While a select group of agencies has achieved compliant status with minimal active violations, the majority of agencies remain at High Compliance Risk. The gap between leaders and the rest of the industry is wide — and consequential.
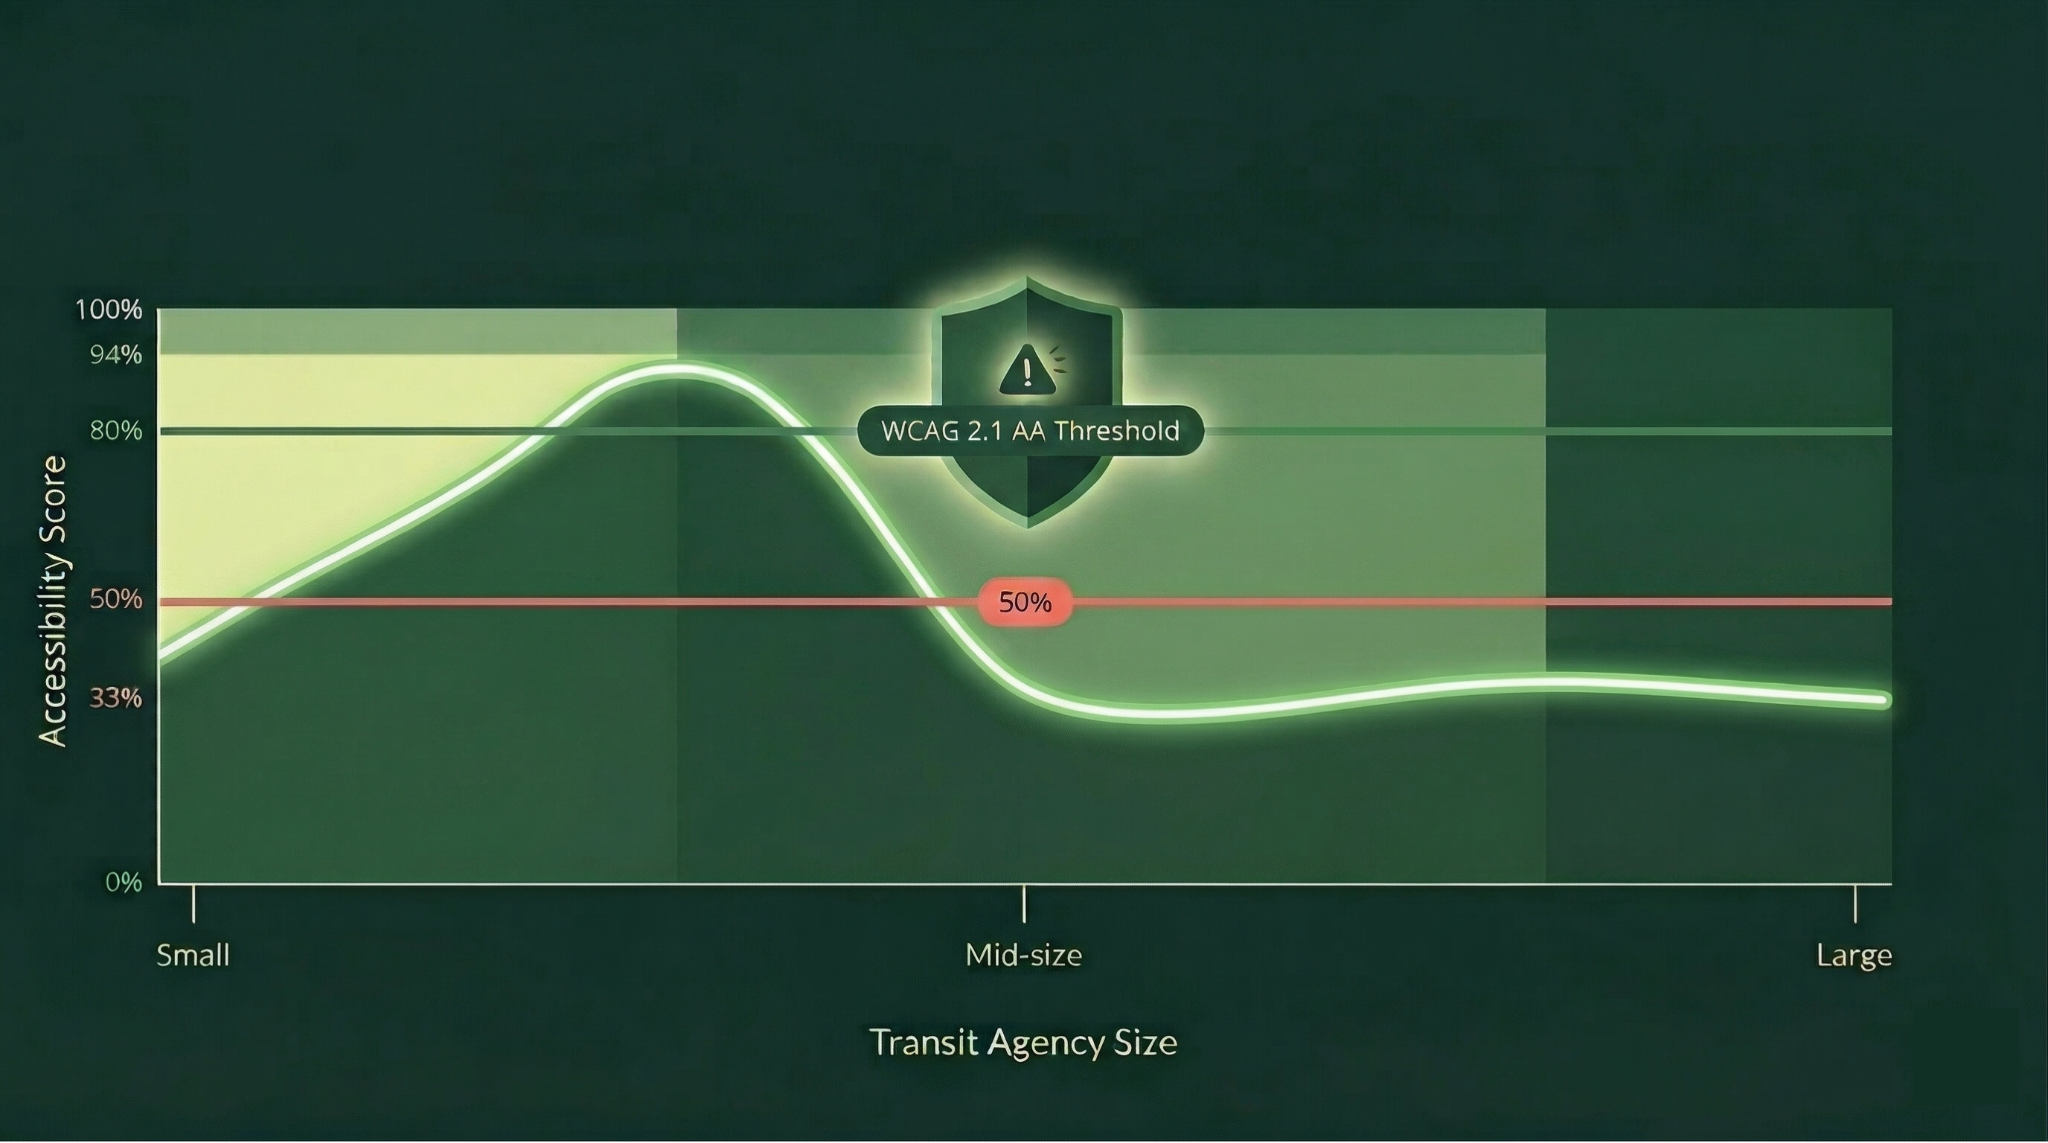
Critically, the data reveals that compliance does not automatically follow budget or ridership volume. Some of the most accessible transit platforms in the country belong to mid-sized and smaller agencies that have prioritized inclusive design and invested in streamlined digital architecture. Conversely, several of the nation's largest and most complex networks carry some of the highest violation counts — a direct reflection of the density and legacy nature of their digital platforms.
The national range of accessibility scores spans from below 33% to above 94%, with the industry average clustering well below the WCAG 2.1 AA threshold. This variance underscores a fundamental truth: accessibility is an investment decision, not an automatic outcome of scale.
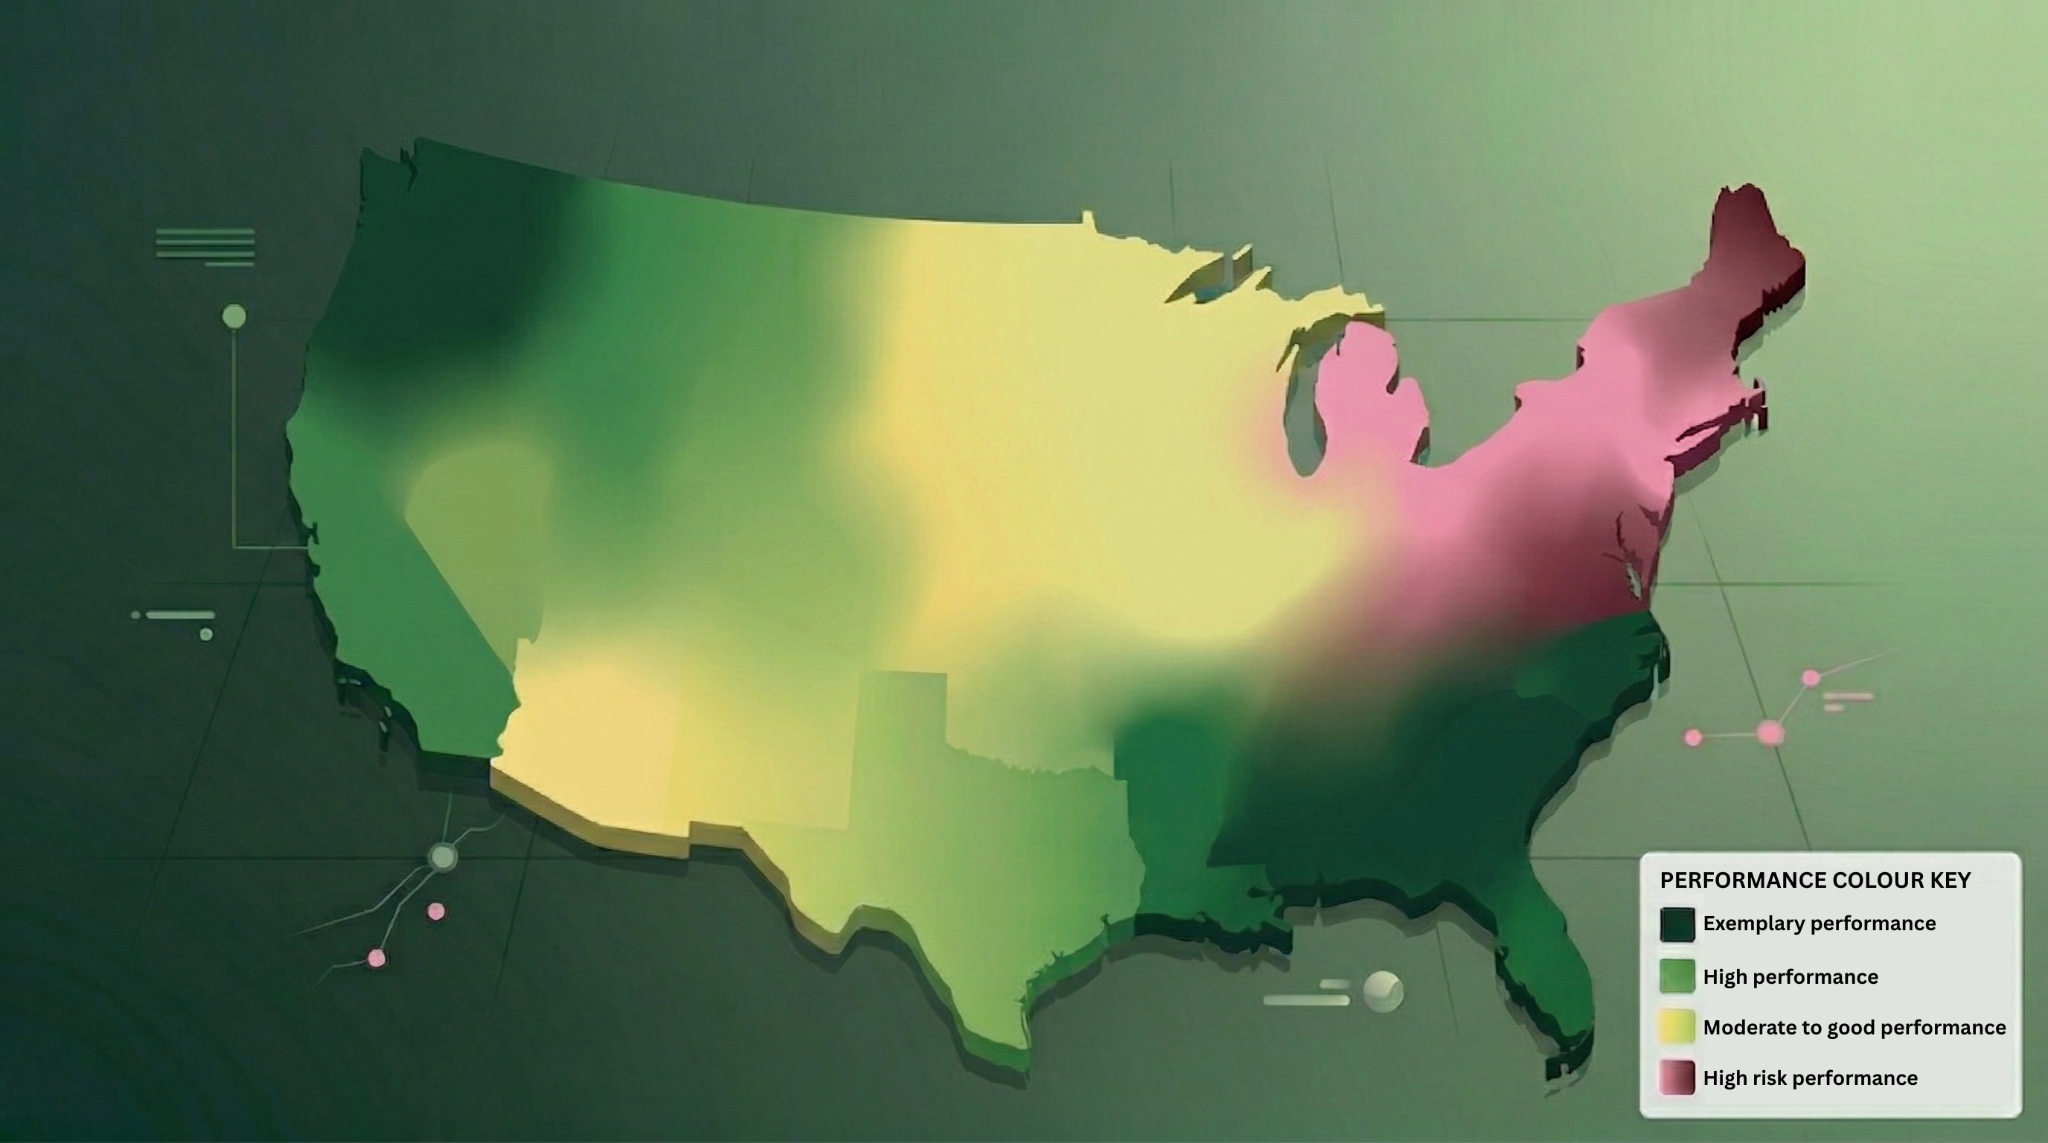
Regional Performance Trends
Northeast & Mid-Atlantic
Transit systems in this region frequently manage legacy digital platforms that require substantial updates to meet modern WCAG standards. Scores for large agencies in this corridor commonly hover in the 47%–60% range, with particularly high violation counts on complex, multi-modal network sites. Smaller commuter rail and local transit systems in this region, however, often outperform their larger peers — demonstrating that architectural simplicity and focused investment can make a meaningful difference.
Southeast
The Southeast contains some of the most notable examples of national leadership in digital compliance. Two agencies in this region represent the national top tier, achieving accessibility scores of 94% and 95% with all active violations resolved — a genuine gold standard for the industry. These agencies serve as proof points that full compliance is not only achievable, but sustainable. Other systems in the region show a wider performance range, indicating that the leadership model has yet to be uniformly adopted.
Midwest
The Midwest displays a broad spectrum of digital maturity, with significant variance between rail-focused and bus-focused agencies. One rail-centric agency achieved an 83% accessibility score with a Low Compliance Risk profile, ranking among the national leaders. However, several major municipal bus systems currently report scores below 50%, with particularly high violation counts in categories affecting blind users and those with mobility impairments. The region's variance suggests that targeted, consistent investment — rather than size or geography — is the determining factor
West & Pacific
This region features both high-performing outliers and significant remediation opportunities. Several agencies in the Pacific Northwest have achieved Low Compliance Risk status with scores exceeding 70%, and one regional leader reached a 93% accessibility score — among the highest recorded nationally. Large-scale multi-modal agencies in major metropolitan areas, by contrast, often operate with scores between 45% and 55%, pointing to a need for deeper integration of both automated and manual testing workflows.
Southwest & Mountain
Performance in this region is characterized by a general commitment to improvement, though complex web architectures at high-volume agencies present ongoing challenges. Large agencies in this region typically see scores ranging from 33% to 62%, while smaller regional entities demonstrate that scores above 60% are consistently attainable with targeted investment.
The Most Common Accessibility Barriers in Transit
When evaluating the specific types of violations found across transit platforms, four categories emerge as persistent industry-wide challenges:
1. Screen Reader Compatibility (Visual Impairments) This is the single largest category of failures across the industry. Missing or improper alt-text on dynamic system maps, untagged route tables, and non-semantic page structures routinely generate dozens — and sometimes hundreds — of violations per site. For the estimated 7.6 million Americans who are blind or have severe visual impairments, these failures make independent trip planning effectively impossible.
2. Keyboard Navigation (Mobility Impairments) The second most common barrier affects users who rely on keyboard navigation rather than a mouse or touchscreen. High mobility failure rates — often registering 40 to 60+ failures per site — indicate that dynamic features like trip planners, drop-down menus, and interactive maps frequently trap keyboard users in inaccessible loops. For riders with motor disabilities, this renders the most-used features on a transit site entirely unusable.
3. Cognitive & Attention Accessibility Many transit sites feature complex interfaces, dense information hierarchies, and unclear navigation structures that create barriers for neurodivergent users or those with cognitive disabilities. These violations make it difficult to successfully plan a trip — a task that should be straightforward for every rider.
4. Low Vision & Color Contrast Inadequate color contrast between text and backgrounds is one of the most prevalent — and most easily remediated — violations in the industry. Globally, approximately 246 million people live with moderate to severe vision impairment, and proper contrast ratios are one of the most basic requirements of WCAG 2.1 AA compliance. Colorblindness-specific violations, while less common, remain a recurring issue on sites that rely heavily on color-coded route maps without alternative indicators.
Sector-Specific Considerations
The accessibility landscape also varies meaningfully by service type:
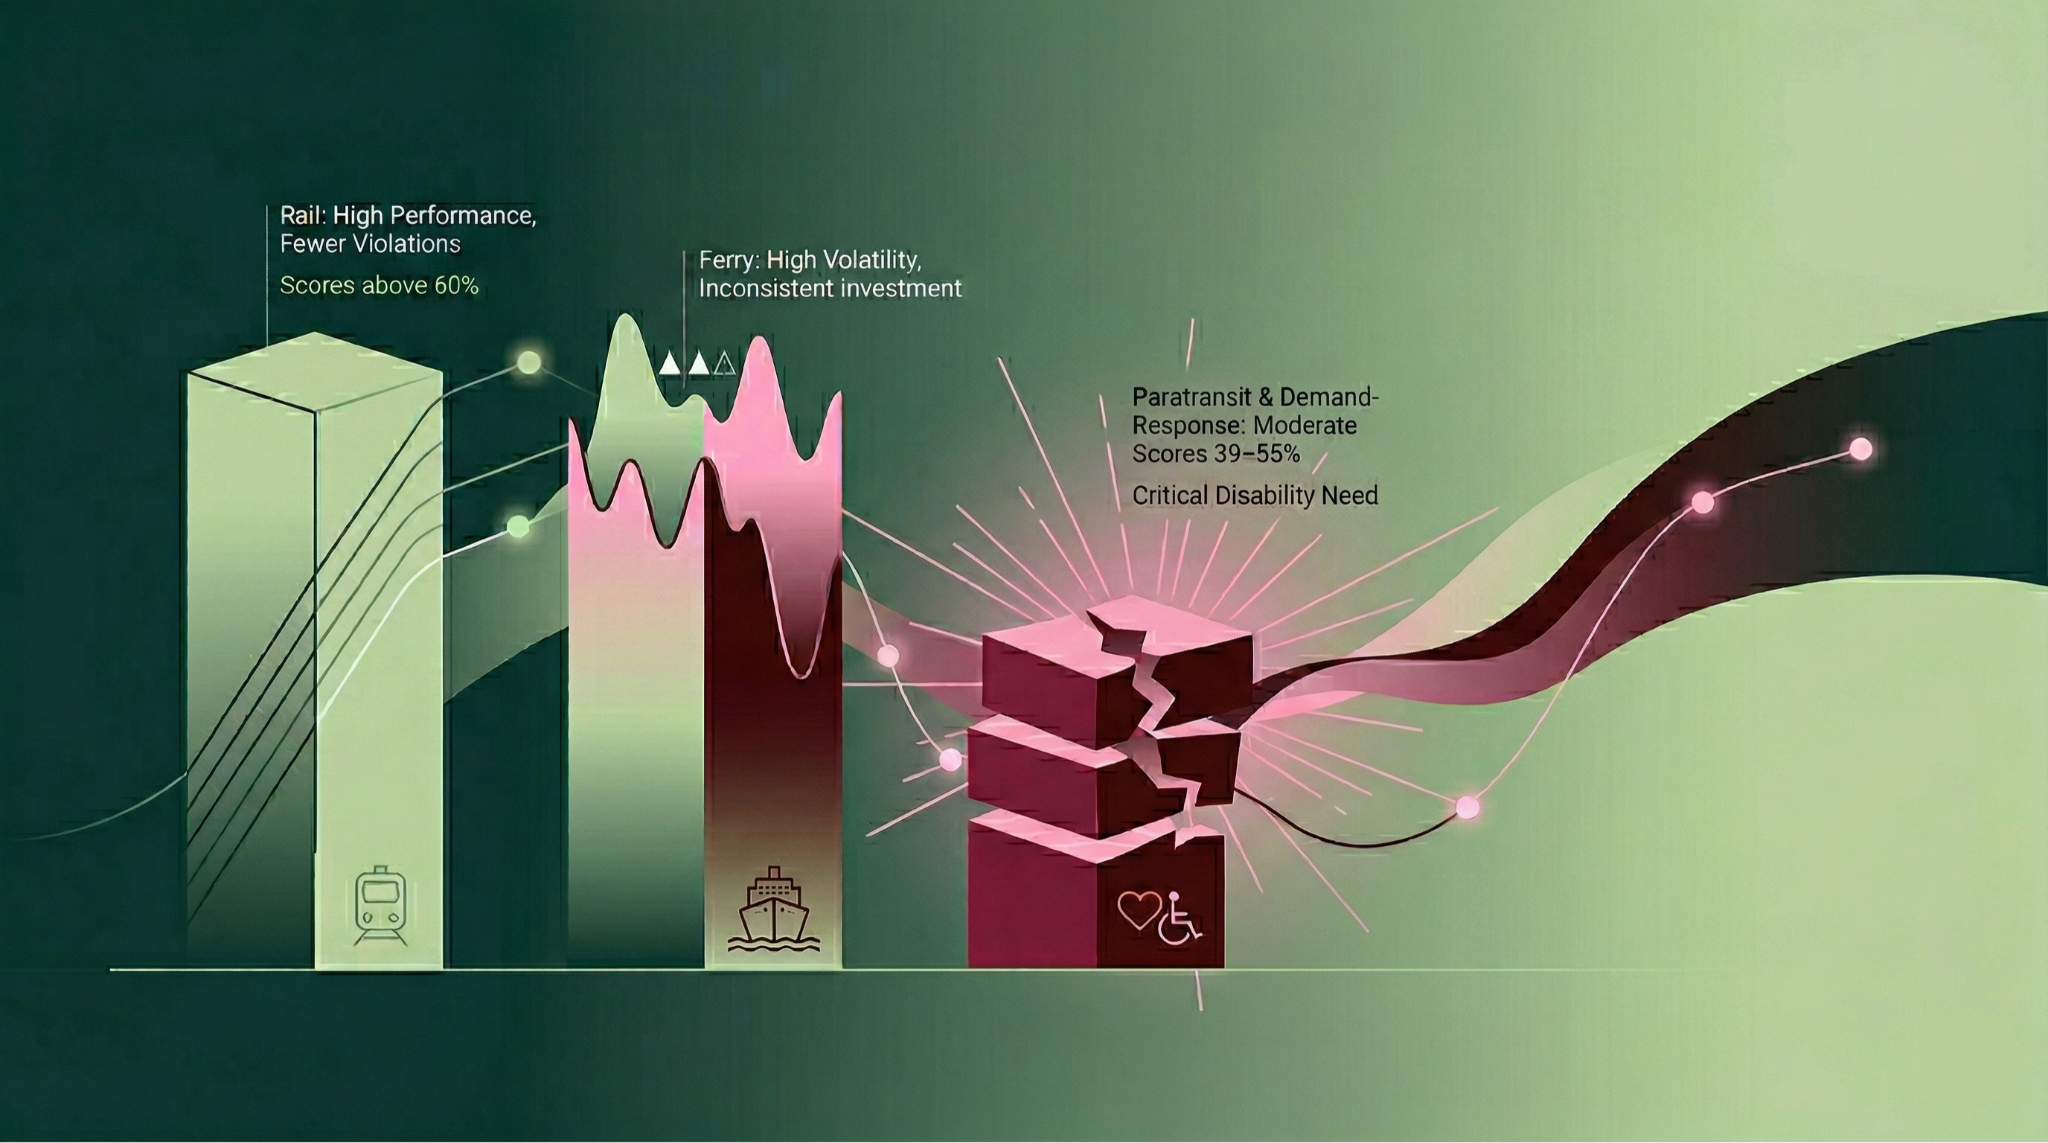
Rail & Commuter Rail agencies tend to perform slightly above the national average, often maintaining scores above 60% with fewer active violations compared to bus-only agencies — likely reflecting newer platform investments.
Ferry Systems show high volatility, with some services maintaining Low Risk profiles while others fall well into the High Compliance Risk category, often reflecting inconsistent investment across regional operators.
Paratransit & Demand-Response Services — the services most critical to riders with disabilities — frequently maintain only moderate scores between 39% and 55%. The irony of the most disability-dependent services having below-average digital accessibility is a clear signal of where prioritization is needed.
The Path Forward: Turning Compliance Risk into Community Leadership
The 2026 benchmark data should not be read as a condemnation of transit agencies — it should be read as a clear roadmap. Every violation identified is a concrete, solvable problem. Every agency that has achieved top-tier compliance has done so through deliberate investment and the right partnerships.
For agencies looking to move from High Compliance Risk to certified leadership, the roadmap is well-established:
1. Audit and Prioritize Begin with a comprehensive accessibility audit that goes beyond automated scanning to include manual evaluation and real-world usability testing with individuals who use assistive technologies. Automated tools catch roughly 30–40% of WCAG violations — human testing closes the gap.
2. Remediate High-Impact Barriers First Focus initial remediation on screen reader compatibility and keyboard navigation failures, which represent the highest violation counts and the most severe user impact. Address dynamic features like trip planners and route maps as a priority.
3. Embed Accessibility in the Content Workflow Sustainable compliance requires more than a one-time fix. Transit agencies that maintain top-tier scores do so by integrating accessibility standards into their content publishing processes — ensuring that new pages, PDFs, and service alerts are created accessibly from the start.
4. Move Ahead of the Deadline With DOJ compliance dates in April 2026 and 2027, agencies that are still in the assessment phase are already operating in a compressed timeline. Beginning remediation now is not just prudent — it is essential to avoiding legal exposure.
Conclusion: Your Website Is the First Leg of the Journey
When a rider with a disability cannot navigate a transit website to plan a trip, find an accessible station, or check a schedule, the journey ends before it begins. The digital platform is not a secondary service — it is the front door to everything transit agencies provide. The good news is that the industry has clear models of what excellence looks like. Top-performing agencies have proven that scores above 90% are achievable, maintainable, and transformative — both for riders and for the agencies that serve them. The mandate is clear. The deadline is near. And the path forward is proven. The benchmark data in this report was compiled and analyzed by Exemplifi, a digital accessibility firm specializing in public sector compliance. Exemplifi works directly with transit agencies to move from audit to remediation to long-term, sustainable accessibility — helping agencies not just meet the DOJ's WCAG 2.1 AA mandate, but lead on it. For transit agencies ready to close the compliance gap and serve every rider from the very first click, connect with the Exemplifi team.
Data referenced in this report is based on automated accessibility scans of more than 180 U.S. transit agency platforms conducted in March 2026, supplemented by industry benchmark analysis. All figures reflect findings at the time of evaluation.